
Restating the post title beyond the limited Wix title allowance: What Are The Known Fatal Yarnell Hill Fire Weather Factors Explaining What Led Up To The June 30, 2013, GMHS Fatalities? Part 1
Views expressed to "the public at large” and "of public concern"
DISCLAIMER: Please fully read the front page of the website (link below) before reading any of the posts ( www.yarnellhillfirerevelations.com )
The authors and the blog are not responsible for misuse, reuse, recycled and cited and/or uncited copies of content within this blog by others. The content even though we are presenting it public if being reused must get written permission in doing so due to copyrighted material. Thank you.
Abbreviations used: Wildland Firefighters (WFs) - Firefighters (FFs).
"Fire and hail, snow and mist, stormy wind fulfilling his word!" Psalm 48:8 (NKJV)
"The National Wildfire Coordinating Group (NWCG) Fire Weather Subcommittee (FWSC) provides national leadership in wildland fire weather and climatology in support of effective fire management decision-making".
This is a fairly comprehensive post for all you Wildland Fire Weather Nerds (and prospective Wildland Fire Weather Nerds) that will examine the wildland fire weather that ensued on the June 30, 2013, Yarnell Hill Fire (posted more-or-less in chronological order based on publication dates) from the perspectives of and research of several of the professionally recognized prominent meteorologists and meteorology forums, e.g. University of Wisconsin-Madison CIMMS (2013), Cliff Mass Weather Blog (2013), Wasatch Weather Weenies (2013), Arizona Republic Pulitzer Prize winner (2014), and Prescott, AZ Embry-Riddle Aeronautical University (ERAU) Dr, Michael Kaplan, et al (2021); Ising et al (2022); NOAA Storm Prediction Center (SPC) Fire Weather Outlook archives, NOAA GIBBS satellite Water Vapor Imagery (WVI) archives; and wildland fire weather videos and tutorials.
Images from the Univ. of WI-CIMMS, Cliff Mass Blog, and Wasatch Weather Weenies will not include figure numbers or captions as they are embedded within the images.
Regarding human factors, it is generally accepted and recognized that the GMHS fatalities occurred because of several possible "Friendly Fire" and firing operations in and along the Sesame Street and Shrine Corridor, the Boulder Springs Ranch (BSR), and the spur roads heading into Peeples Valley and Yarnell.
Credible Evidence Continues to Surface Regarding a Likely "Friendly Fire" Incident Along the Sesame Street and Shrine Corridor Area on June 30, 2013 ( https://doi.org/10.1007/978-3-030-50946-0_47 )
It Could Not Be Seen Because It Could Not Be Believed on June 30, 2013
The Yarnell Hill Fire: A review of lessons learned McCrea (June 2014) International Association of Wildland Fire (IAWF)
Behind the weather that led to the deadly Yarnell Hill Fire
Formerly Unrevealed Public Records Should Change the Account of What Occurred on June 30, 2013 ( 10.1007/978-3-030-20037-4_3 )

Figure 1. Snippet of Ising, Kaplan, and Lin (2022) Figure 6. indicating original sources and observed reflectivity mosaic from KFLX (Flagstaff, AZ, USA) 30 June 2013: (a) 1315, (b) 1340, (c) 1400, (d) 1500, (e) 1515, and (f) 1645 MST (source: NCEI GIS Map Portal). The red circle in (a) denotes a small cell that had developed west of Cherry, AZ, USA, and North of Dewey, AZ, USA, around 1315 MST (source: NCEI GIS Map Portal) Source: Ising, Kaplan, and Lin (2022)
But first the basics. Because this post concerns wildland fire weather, it is prudent to begin with the recognized Rules of Engagement ("10 & 18") for Entrapment Avoidance that specifically relates to fire weather for those WF, FF, as well as non-WF and FF readers alike.
The first Fire Order states 1. Keep informed on fire weather conditions and forecasts.
The Watch Out Situations as guidelines dealing specifically with fire weather state:
4. Unfamiliar with weather and local factors influencing fire behavior.
14. Weather becoming hotter and drier.
15. Wind increases and/or changes direction.
Because Fire Weather determines fire behavior, in reality, from a wildland firefighter perspective, it is safe to say that all of the other Watch Out Situations are affected in one way or another by fire weather during firefighting and aircraft operations. Yes, even taking a nap near the fireline.
This is an NWCG Fire Weather Subcommittee Glossary of Terms that may be useful throughout this post.

This author strongly advocates first becoming Students of Weather and then becoming Students of Fire as Paul Gleason (RiP) advocated because we should know that it is the weather that determines fire behavior.
Figure 2. Snippet of Paul Gleason Student of Fire quote Source: WLF LLC (6/10/22)
"He answered and said to them, 'When it is evening you say, ‘It will be fair weather, for the sky is red’; and in the morning, ‘It will be foul weather today, for the sky is red and threatening.’ Hypocrites! You know how to discern the face of the sky, but you cannot discern the signs of the times." Matthew 16:2-3 (NKJV)
Here is a link to numerous Bible verses concerning the weather. (https://bible.knowing-jesus.com/topics/Weather)
"The [NWCG] Fire Environment Committee (FENC) provides national leadership in measuring and predicting the wildland fire environment. The FENC develops, disseminates, and promotes national standards for fire behavior prediction, fire danger rating, and fire weather forecasting."
"Following a December 2006 presentation to the National Oceanic and Atmospheric Administration (NOAA) Science Advisory Board (SAB), the SAB established a Fire Weather Research Working Group (FWRWG) and charged it with conducting a review of NOAA’s operationally-oriented fire weather research activities. Specifically, the FWRWG was chartered to (1) ensure NOAA’s fire weather research priorities meet the needs of the federal wildland management agencies, and (2) explore opportunities to leverage current NOAA internal and external collaborative fire weather research efforts to ensure improvements to NOAA’s fire weather products and services are implemented in a timely manner. FWRWG members were
26 academics, researchers, and operational users of, and private-sector contributors to, NOAA’s fire weather information."
"Fire Weather -"The fire weather program is managed and coordinated by the WFM Fuels Management Section, which has one staff member designated as the national fire weather program manager. This program provides funding and technical support for the maintenance of station sensors and the accuracy of station data for the wildland fire program.
All field-level units will identify at least one permanent, NFDRS fire weather station for fire planning purposes. A listing of these designated weather stations is maintained by the WFM Fuels Management staff and is updated annually. Each Region must identify a Regional Point of Contact (RPOC), and each Agency/Tribe must identify a Local Point of Contact (LPOC) for fire weather and weather stations." NIFC Interagency Red Book
“Wind extinguishes a candle and energizes fire. ... You want to be the fire and wish for the wind. ..." Black Swan author Nassim Taleb, from Antifragile: Things That Gain From Disorder
What follows is from the University of Wisconsin-Madison Cooperative Institute for Meteorological Satellite Studies (CIMSS) Satellite Blog for the "Yarnell Hill Fire in Arizona" on June 30, 2013, by Scott Bachmeier. This is an excellent post with several interactive animated videos of satellite imagery. Screenshots and text will be provided below to accompany the text and to pique your interest to watch the informative video clips from the relevant CIMSS link. The relevant image Screenshots include the original captions.

"The Yarnell Hill Fire (InciWeb) was a relatively small wildfire that was started by lightning from a dry thunderstorm southwest of Prescott, Arizona on 28 June 2013. However, fire conditions became more favorable for growth on 30 June, as surface air temperatures rose above 100 F across the area with low relative humidity values. During the afternoon hours, GOES-15 0.63 µm visible channel images (above; click image to play animation; also available as a QuickTime movie) showed that a line of thunderstorms developed over northwestern Arizona, and moved toward the southwest (the red circle highlights the general area of the Yarnell fire). It is likely that strong surface winds associated with a thunderstorm outflow boundary (nearby surface mesonet data) caused rapid growth and an abrupt change in direction of the fire, which tragically killed 19 firefighters who attempted to shelter in place (for additional details, see the Wildfire Today site).
"On the GOES-15 visible imagery, a smoke plume became more obvious after 16:45 UTC, with the first formation of pyrocumulus clouds evident at 21:00 and 21:30 UTC. As the cloud shield of the thunderstorm line moved over the fire, the images revealed the development of a pyrocumulonimbus (pyroCb) cloud which exhibited a pronounced overshooting top at 23:45 UTC."

"Taking a look at the period of pyroCb formation, the overshooting plume and pronounced overshooting top could be seen spreading southward (due to northerly winds aloft, as shown on Flagstaff AZ rawinsonde data) on the GOES-15 0.63 µm visible images (above) — and this pyroCb plume and overshooting top appeared warmer/darker on GOES-15 3.9 µm shortwave IR images (below), which indicated that the plume was comprised of smaller particles which were more efficient reflectors of solar radiation."

"On GOES-15 10.7 µm longwave IR images (below), the coldest cloud top IR brightness temperature of -65 C (darker red color enhancement) was associated with the overshooting top at 23:45 UTC."

"Shown below is a comparison of the 23:45 UTC images of GOES-15 visible, shortwave IR, and longwave IR images."

"A comparison of Suomi NPP 0.64 µm visible channel and 11.45 µm IR channel images at 21:22 UTC (below) showed the Yarnell fire 'hot spot'. (dark black pixels), with some pyrocumulus clouds beginning to form to the east/northeast of the fire source (due to strong southwesterly winds in the boundary layer)."

"The corresponding Suomi NPP VIIRS true-color image is shown below, visualized using the SSEC Web Map Server. Again, the smoke plume from the fire can be seen, along with the development of pyrocumulus clouds to the east/northeast."

"Volumetric displays of Flagstaff, Arizona WSR-88D radar base reflectivity and spectrum width are shown above and below, respectively (radar data visualized using GR2Analyst software, courtesy of Jordan Gerth, CIMSS). The viewing perspective is looking from the northwest, so Prescott is located in the left corner of the data cube, and the Yarnell fire with its growing pyrocumulus (pyroCu) and pyrocumulonimbus (pyroCb) cloud is located in the right corner of the data cube."
"The blue-shaded isosurface of the 13.5 dBZ base reflectivity (from 22:42 to 23:48 UTC) showed the upward pulsing of the pyroCu and finally the pyroCb, which grew upward past an altitude of 40,000 feet on the final image (23:48 UTC, about the time that the prominent overshooting top was seen on the 23:45 UTC GOES-15 visible image)."
"The Doppler radar spectrum width is shown from 23:34 to 23:48 UTC. This parameter represents the amount of variance in the velocity field. Note the higher spectrum width values (darker orange shading) associated with the growth of the pyroCb cloud over the Yarnell fire — this was likely a result of the variety of particles (biomass burning particles, supercooled water droplets, ice crystals) moving upward at different velocities because of their differing size and shape characteristics."

All the above are Snippets of the CIMSS website animations. You will have to go to the main CIMSS link and then the animation links to watch them
This CIMSS post had only one accurate and very insightful comment by Jeff, including stating that this "was clearly predictable and preventable" and that several of the Watch Out Situations "applied" instead of the usually erroneously stated as "violations of the Watch Outs" on 13 July 2013 at 1:37. It's impossible to actually "violate a Watch Out", right? How do you violate "the weather is getting hotter and drier?
"Good information and good work.
This tragic event was clearly predictable and preventable once we focus on the wildland firefighting rules.
Several of the Common Denominators to tragedy fires were in place: (1) light, flashy fuels, (2) isolated sectors of large fires, (3) in or adjacent to chimneys, chutes, or bowls, and (4) unexpected shifts in wind direction or wind speed.
The primary Ten Standard Fire Orders relevant were: (1) Keep informed on fire weather conditions and forecasts, (2) Know what your fire is doing at all times, and (3) Base all actions on current and expected fire behavior.
Several of the 18 Situations that shout Watch Out applied: (11) Unburned fuel between you and the fire, (14) Winds increases and/or changes direction, and (17) Terrain and fuels make travel to safety difficult.
Several of the Look Up, Down, and Around fire environmental factors and indicators applied listed in the Incident Response Pocket Guide on pages 2-3.
Hopefully, this will help to prevent further tragedies. May God be with the families, friends, loved ones, and those firefighters also involved."
Consider now the accurate and insightful July 2, 2013, Cliff Mass Weather Blog titled: The Yarnell Hill Fire: The Meteorological Origins
"This morning I took a look at the meteorology associated with the Yarnell Hill fire in Arizona on Sunday, and the more I dug into it, the more disturbed I got. You will see why as I explain."
"From what I can glean from news reports, the fire blew up around 4-5 PM Sunday (June 30th). A nearby observation site (RAWS station) was located about 5 miles away. The observations, shown below, indicates a profound wind shift from south to north around 5 PM associated with a sudden increase of wind gusts to just over 40 mph. Solar radiation dropped rapidly at the same time, indicating a sudden increase in cloudiness."

"The origin of this sudden increase in wind is clear: outflow from a line of convection (thunderstorms) that had developed during the preceding hours and which was moving to the southwest. Here are some satellite images for the hours preceding and during the terrible accident (the circle indicates the location of the fire). First image (20 UTC, 1 PM MDT, no daylight savings time there) shows the convective line to the northeast."

"By 2230 UTC (3:30 PM MST) the convective line was approaching the fire and clouds had spread over the location."

"A little over an hour later (2345 UTC) one can clearly see the development of a cumulus tower directly over the fire. This is call[ed] pyrocumulus. The heat from the fire can cause a tall cumulus cloud to form directly over the fire."

"The Flagstaff National Weather Service radar clearly showed the approaching convection. Here is the radar at 2:58 PM. You can see the arc of red/yellow/green colors approaching the fire from the NE."

"There is often an outflow of cooler air moving away from convection...the leading edge is known as a gust front (see figure below). Downdraft air from thunderstorms spread out as it hits the surface, producing strong winds. It appears that there was such strong outflow from this convection that caused the ..."

"... winds to shift rapidly from southerly to northerly and to increase suddenly in speed (to 43 mph at the nearby station). The vertical sounding at Flagstaff, Arizona at 0000 UTC July 1 (5 PM on Sunday) showed the potential for strong, downdraft winds, with a moist layer at midlevels (the temperature and dew point close together between 650 and 300 hPa) and dry air (big separation between temperature and dew point) near the surface (see graphic). As rain falls into dry air, there is strong evaporation and cooling, that produces negatively buoyant (descending) air parcels that accelerate towards the surface. When they hit the surface they spread out, producing intense horizontal winds."

"A measure of the potential for strong downdrafts and gust fronts is something called downdraft convective available potential energy (DCAPE). The sounding at Flagstaff has values of around 1600 J per Kg, which is very high (anything above 1000 can produce strong downdrafts).
"The existence of the strong convective outflow winds is confirmed by an amazing video of the area from 4 to 4:20 PM (click on image to view, cam viewing north). You will see strong winds picking up, an explosion of the fire, and then smoke pushing down towards the cam. You can see a fire line explode along the crest."

This is a Snippet of the Matt Oss Vimeo video of June 30, 2013, intense fire behavior taken from Congress, AZ (see below)
"So it is apparent what occurred ..first the winds were from the south, followed by a rapid shift of 180 degrees, sudden increase of winds to over 40 mph, and the fire blew up and reversed direction."
Figure 3. June 30, 2013, Yarnell Hill Wildfire Time Lapse. Source: Matt Oss, Vimeo
This time-lapse video clearly reveals the explosive fire behavior leading up to and including the GMHS entrapment, burnover, and fatalities that occurred during this 1630 (4;30 PM) to 1650 (4;50 PM) timeframe. This is a stunning video.
“But God has not walked away from the day-to-day control of His creation. Certainly, He has established physical laws by which He governs the forces of nature, but those laws continuously operate according to His sovereign will. A Christian TV meteorologist has determined that there are over 1,400 references to weather terminology in the Bible. Many of these references attribute the outworking of weather directly to the hand of God.” (Trusting God: Even When Life Hurts - Jerry Bridges)
"Better de-flickered version - Wildfire. Viewed from the south off of highway 89, the flames reach the peak of the mountain. Created by Matt Oss Twitter - mattoss21 -Better de-flickered version - mattossphotography.com Edit - 4:30 PM is when the video starts and ends at 4:50 PM"
From Matt Oss - the Vimeo version - Yarnell Hill Fire from Congress, AZ: A time-lapse shot on 6/30/13 at 4:30 PM of the Yarnell Hill Wildfire. Viewed from the south off of highway 89, the flames reach the peak of the mountain. Created by Matt Oss - Gallery of my photos from 6/30/13 -
( mattossphotography.com/yarnellfiregallery/ ) Twitter - @mattoss21
mattossphotography.com "John, looking back I would say I was looking directly north maybe 5 - 10 degrees to the east. This gives a great summary in the animation near the bottom. ( nytimes.com/2013/07/07/us/a-painful-mix-of-fire-wind-and-questions.html?hp )" This NYT link requires a subscription to access the article.

"The forecast for 4 PM shows the winds reaching the fire site."

"The University of Arizona WRF forecasting system also indicated the potential for strong convection-related winds. (see graphic, click to expand)"

"You can see why I find this disaster so unsettling. Hours before the incident it was clear there was a real threat...satellite and radar showed developing convection to the north that was moving south towards the fire. High-resolution numerical models showed a threat. Were there any meteorologists working the fire? If not, why not? This terrible tragedy needs to be reviewed carefully."
"A number of media outlets called the strong winds unpredictable and random. This is not correct, as shown by the information I provided above."
Please take the time to read through these various comments from a medley of posters as many of them are very well thought out and fairly well articulated with valid points of contention and questions. And, of course, there are others far afield of that as you'll readily notice. All emphasis, including font changes, and hyperlinks is added below unless otherwise noted.
28 comments:
UnknownJuly 2, 2013 at 12:42 PM I think asking "Why not?" is definitely the right question. And if the proper resources were assisting with the fire, did they raise an alarm? And was it ignored?
It's hard to see something like this happen and see that it was so completely preventable if the proper resources had been applied.
[An author comment is necessary here with a relevant explanatory excerpt from a 2018 AHFE paper titled: "Epic Human Failure on June 30, 2013." -- "Thus, the GMHS would primarily “see” the weather and fire behavior that they were focused on, however, their own brains may have sabotaged or delayed their ability to perceive and react to threats from those recognized hazards or even from the focus they were directing their attention to, typical of all humans engaged in this type of encounter [17] [see 17. Shomstein, S., Yantis, S.: Control of attention shifts between vision and audition in human cortex. J. Neurosci.24, 10702–10706 (2004)]. Numerous cell phone and radio conversations occurred during the YH Fire, likely distracting them from truly ‘seeing’ the emerging weather and fire behavior hazards and reevaluating priorities contributing to their steady drift into failure [11, 17]. The firefighters were aware of the forecast weather that morning; the risk factor was high enough to make them think twice, but they deferred to their own judgment, unknowingly falling victim to distractions. The weather forecast warned of considerable thunderstorm outflow wind danger, but the GMHS seemingly discounted those warnings, and left their Safety Zone at the worst possible time [7]. Arizona is well known for its dynamic, sometimes tragic large fires; late June is considered extremely hazardous, i.e. the Dude Fire (1990) when 6 WFF died, where severe outflow winds also set the stage for potential deathtraps, and where harsh Human Failure also won out.]
Thanks for the research on this! Tim Vashon
Great report Cliff, the best I have read yet.
I was involved in the formation of Prescott's very first hotshot crew back in the early 70's. It started out as a Type II crew then became a Type 1 hotshot crew in 1973 -all under the USFS. It was mainly composed of college students that were active rock climbers, mountaineers and environmentalists. It was co-ed, it fought fires safely all over the West, including that big one in Twisp years ago, it even did some helitac work although it was not a helitac team per se. The Granite Mountain Hotshots started in 2002 under the City of Prescott Fire Department, it was an inter-agency team. [The author notes a clarification here that they were a city of Prescott FD Fuels Crew (Crew 7) and finally became an Interagency as stated in 2009]
One thing that is driving me crazy about the way the media is reporting this is exactly what you point out - that somehow the weather was all a big surprise.
What people do not seem to realize is that the fire itself creates its own dynamics, this is well known and should be anticipated. Planning an attack on a wildfire starts out with a series of "IF" questions, the biggest of which is: "What IF what we think turns out to be wrong? If we go to position X, what do we do if the winds reverse or change? What do we do if things go to hell?"
"Over the years, a series of rules and methods have been developed that account for
even the most extreme conditions. It is a well known pattern of tragedies that no single decision is the cause, it is a series of mistakes, miscalculations and misjudgements taken together that are the problem. This time it will be no different. Losing an entire hotshot crew means some bad thing happened at the response co-ordination level, weather communications being just one."
Meteorologist was available, but has to be -- and was not -- requested by the fire manager, per this:
(http://www.climatecentral.org/news/satellite-provides-clues-about-deadly-ya"rnell-hill-fire-16179)
[An author comment is necessary here. Hank Roberts is correct, however, the author notes a clarification here. However, the link he provides states: "The National Oceanic and Atmospheric Administration (NOAA) has sent an incident meteorologist, known as an IMET, to be embedded with the Yarnell HIll (sic) firefighting teams." That may have been the case for the incoming Type One and Two IMTs ordered later in the day June 30, 2013, but not the original Type 4 IMT.]
(posted by dbostrom here)
"Were there any meteorologists working the fire? If not, why not?"
Cliff, you do understand that the fire occurred in Arizona and that the state government there is dominated by one political party whose emphasis has been tax cuts vice public service, right?
And you are aware the federal budget cuts often called "sequestration" chopped 5 percent from the U.S. Forest Service's Fire and Aviation Management Budget in fiscal 2013, right?
The answer to your question is "free market solutions".
Hindu July 2, 2013 at 9:10 PM
wonderful analysis
This is a very interesting read. Thank you for your research and post. Hopefully this information,along with your questions,will change the protocol for dealing with these fires.
Here is the url to the National Interagency Fire Center website, and "the rules" -the "10 Standard Fire Orders and 18 Watch Out Situations"-if anyone is interested.
(http://www.nifc.gov/safety/safety_10ord_18sit.html) [This link is inaccuarate]
The media has language like "Prescott has one of the 110 hotshot crews" -or some such. Actually, Prescott has 2 hotshot crews, the The Prescott Hotshots which has been a part of the US Forest Service since 1972, and the team that was lost, the Granite Mountain Hotshots which is part of the Prescott Fire Department since 2002. Both are part of the National Interagency Hotshots under NICC coordination.
[The author notes a clarification here - the GMHS was initially ordered by the AZ State Forestry through the SW Coordination Center (SWCC). SWCC would then cancel the order and the AZ State Forestry and/or the Prescott FD reordered the GMHS by and email and/or phone call. The GMHS had been told that they were "Unavailable."]
Cliff, Great analysis. The 2013 Wildfire Safety refresher had two modules where they talked about the weather (www.nifc.gov/wfstar/) Tim, Excellent link and also this one (www.floridaforestservice.com/wildfire/safety_wf_tragedy.html) Both of these lists are printed on the Fireline Handbook. The class room portion of the S-130/S-190 Wildfire Fire Fighter training are on-line. (current "red card")
Thank you for this insightful research. I hope it might help prevent the tragic loss of such brave men. We are likely to see more of this type of events unless more rigor is applied
Scott Bachmeier July 3, 2013 at 7:54 AM
Animations of the GOES visible images (along with a few other satellite image examples) are availabel (sic) on the CIMSS Satellite Blog: (http://cimss.ssec.wisc.edu/goes/blog/archives/13341)
BoingBoing posted a link to a piece on climatewire that looked into this. It seems there were some meteorological staff in the mix but not enough, not in time, etc. It looks like the climax of this came at a shift change or other hiccup in staff awareness. But as you say, there were some predictable elements to this.
[The author notes a clarification here - the commenter above mentioned a "Climate Wire" article. This quote is from a reprinted article. "Not to be overly speculative, but typically, we would have our IMET embedded with the kind of hotshot crew that was overrun by fire on Sunday," she said. "That kind of extremely rapid wind shift that turned the fire against them, that's just the kind of impending hazard, rapid, fast-moving hazard, that the IMETs try to protect the firefighters from." The GMHS had the best view of anyone on the entire YH Fire and the fire weather and fire behavior, along with Air Attack and the Two Eyewitness Hikers (Collura and Gilligan). This author notes that the GMHS had all the Fire Orders at their beck and call and to know and follow them; and all the Watch Out Situations to know, recognize, and mitigate. However, this author alleges that they had a known, recognized habit of Bad Decisions With Good Outcomes. Therefore, an IMET's warning of "an impending hazard, rapid, fast-moving hazard" would have been, and was in fact ignored by them on several previous wildfires, namely the 2012 Holloway Fire in NV and OR that they referred to as "the Nevada Fire" instead of having "protected them." These are validated in numerous AHFE papers, YHFR posts, and during an S-131 Advanced FF, Squad Boss course at an Arizona Wildland Fire Academy by a former GMHS (2011-2013) that was on the 2012 Holloway Fire as being factual.]
Maybe its easier for the managers in this situation to believe it was all random and unpredictable. Otherwise how do you justify the loss of so many young, wonderful people.
I believe the hot shot comand (sic) should have known weather would be unstable by looking up at the large structured cumulus clouds
The storm wind change was no suprise at this time of year. Speaking as a layman who grew up close to Prescott and follows Arizona meteorology closely, what we saw was like clockwork for the unstable winds to change direction from N to S. During this monsoon season, storms began after that 60° dew point mark over AZ. thick forest after a strong bar(s) of High fronts. Every H storm front in July will fall south from the mogollon rim that is a 1000 to 2500 foot drop for aprox 500 miles in length. That storm begans a cold mass and falls fastly toward the heat, which naturally moves S. Swarming cool weather down towards Prescott area almost every day at this time of year. Of course sometime variates in strength about 48 hours by the rise of dew point as energy builds again. So, Prescott valley had the fire blazing (hot air) and the mogollon rim had a Large cold mass falling quickly as expected but with the fire winds are going to change to the S. right away. The wind may shift any direction with the fire and the cold mass ,although a local would expect to see the winds go more south with normal June temps. I believe the hot shot comand (sic) should have known weather would be unstable by looking up at the large structured cumulus clouds push that Cold Air mass that naturally falls towards the heat below 1500 feet. Again, locals expect this storm, and the Yarnell hill fire exaserbates (sic) moisture towards heat and every local would tell you there would be strong winds and maybe rain coming an hour ahead of the front moving S. That fire had a bullseye on it expecting S to SW winds to blow with verga (sic) rain or rain with extreme hail, with the fire that was unlikely to see rain or hail, but strong winds and unstable rain at about 1500 to 1800 hours (mst) will very likely be seen.
"Were there any meteorologists working the fire? If not, why not?" Hi Cliff, decent analysis but the above question needs clarification especially in light of the way off the mark and misguided comment from RentonRebel. Hank Roberts was on the right track. An IMET (Incident Meteorologist) is generally ordered when a Type 1 or 2 fire fighting team is ordered to manage a fire. These teams are ordered when the fire has reached a certain complexity level that requires the greater resources these management teams offer over the local fire departments, Forests, etc. Once a Type 1 or 2 management team is ordered, the team decides if an IMET is needed and ordered up if so. Until then, the firefighting team works with the local NWS office to get the needed weather information. This is done through Spot forecast requests and briefings done over the phone. So, weather support is there from the beginning via the local NWS office or a NWS IMET when one is ordered.
Weather support was ongoing with this fire as well and we will all learn the details of this tragic incident once the investigation team (now assembled) finishes its analysis.
[An author comment is necessary here for the above "investigation team" comment. All the fatality fire alleged “investigations” are based on them first establishing a “conclusion” and then getting the alleged “facts” to support it. In other words, they can write anything they want.]
One thing the fire fighting does very well (beside fighting the fires!) is to learn from these types of incidents to try to prevent future injuries or worse. From someone having been on the ground, one thing that everyone needs to be aware of is this is a VERY dangerous job and that fact that there aren't more "incidents" with the extreme fire behavior we have is a testament to the skills of the fire fighters and the excellent safety procedures already in place.
[An author comment is necessary here for the above "One thing the fire fighting does very well (beside fighting the fires!) is to learn from these types of incidents to try to prevent future injuries or worse." Unfortunately, this is incorrect because of the fact that we are learning" "incomplete lessons" based on my comment above about the alleged "investigations." We will never be able to prevent all wildland fire fatalities, so all we can do is our best to reduce them.]
Along similar lines, my thoughts on the recent wildfire and tornado disasters: (http://www.buzzbernard.com/does-a-hurricane-disaster-loom-why-i%E2%80%99m-worried/) [No longer available even with the Wayback Machine]
(Didn't we learn anything from
Mann Gulch and Storm King Mountain?)
This exact wind phenomenon happened yesterday here in Cottonwood... saw the roll cloud form just like the image. I thought an F-0 tornado was forming. Was a really scary event. Trees looked as if they were going to snap. Winds were probably 40mph. Very accurate analysis, man. My sympathy for the fallen and their families. I shed tears for them. Reply
RentonRebelJuly 3, 2013 at 3:29 PM
@ WXMAN42,
You did not explain why you thought my comment was misguided. Maybe it was just a misunderstanding.
What we knew before the fire was:
a) The frequency and severity of fires has increased by almost 50% since 2000
b) The federal and state budgets have not nearly kept pace with this increase with the amount of resources required to fight these fires and keep the population, property and Fire Fighters prepared and safe.
c) The sequestration which resulted from the Republican party's policy to o longer authorize the payment of the debt it voted to incur has impacted the U.S. Forest Service’s Fire and Aviation Management Budget in fiscal 2013 with 5% chopped out.
d) As Cliff meticulously pointed out, the technology existed to prevent the deadly "surprise" on the Fire Fighters.
I agree that lessons can and will be learned from this disaster.
My point is that we need not wait for death to learn lessons.
Meteorological research and resources are a public good which MUST be financed by the public it supports.
Yes, the process exists where if requested an IMET is assigned. It was not requested in this case.
The ability to assist fire fighters in fires large AND small exists without dependency upon special requests. This ability is specifically not employed because of political budget constraints.
The policy to wait until death necessitates change processes is a political budget decision, one which is demanded by one specific political party and ineffectively repudiated by the other.
RentonRebelJuly 3, 2013 at 3:54 PM @ Adding a citation here to buttress my point. Re CBS News about the House Republican budget authored by Paul Ryan, GOP VP nominee 2012 - March 11, 2011, 4:17 PM (http://www.cbsnews.com/8301-503544_162-20042264-503544.html) The budget, which proposed about $60 billion in budget cuts, would slash funding for the National Weather Service and the National Oceanic and Atmospheric Administration (NOAA). The Republican's (sic) proposed "continuing resolution" to fund the government, which was defeated in the Senate this week, aimed to cut $1.2 billion - or 21 percent - of [PBO's] proposed budget for NOAA, ClimateProgress.org reports.
Thank you for your analysis Dr. Mass. I am an NWS Incident Meteorologist based in Anchorage, AK, and have been serving on wildfire and other incidents since 1990, throughout the US and Australia. The reason there was no Incident Meteorologist at the Yarnell Hill fire when it blew up was that it was still a "Type 2" or "Type 3" fire, not large or complex enough for the "Type 1" rating at that point to require a larger Incident Management Team. Who almost always will request an Incident Meteorologist.
No matter what we do as well, as Incident Meteorologists, there are some realities to face. For instance, while serving as an IMET on a fire near Stanley, ID in 2006 I forecast isolated dry thunderstorms to occur in the afternoon around the fire area. The region around Stanley is outside of WSR-88D radar coverage from either Boise or Pocatello. All I had to go on for my weather watching was lightning detection and satellite.
At 4 pm that day (9/02/2006) isolated thunderstorms developed over one of the fires in the complex, and a strong downburst wind pushed the fire toward 34 crewmembers. I was not able to warn for this, lightning detection just showed 1-2 strikes after the fact some miles away. The fire was 20 miles from camp where I was stationed, and not even visible from it. Yet all 34 firefighters were able to run through their pre-defined escape route to their safety zone, and made it. They were out of radio contact with our base for 90 minutes while this was occurring! You can bet we all were petrified at that time.
So it is the training and quick action of the firefighters following their standard orders, in addition to our weather support, that keeps everyone safe. Thank you, Michael Richmond
AnonymousJuly 4, 2013 at 8:26 AM
High Base Thunderstorm rolled in (as predicted in morning fire weather discussion) blew the fire in all directions, and brought Mother Nature her tragedy. It's as simple as that. As Michael said you can't have IMETS on every fire. But you can utilise the local office for spot fire weather forecast and the like.
There are a couple of things bothering me at this time. Live and dead fuel moistures at the time of the event were at historic lows. Fuel loading was at historic highs. As Malcolm Gladwell would say; "this is an outlier". This type of weather is typical for this burning period. What was not typical was the state of the fuels. On any other year a red flag watch or warning would not be issued for this geographical area for the threat of thunderstorms. But on Sunday with the georgrahical (sic) area under extreme burning conditions maybe it least a red flag watch could have been posted. I don't want to armchair the weather office but it needs to be looked at. You don't want to be pulling the flag up unless it warrants it. South Canyon was issued a red flag warning in 1994. Chris Cuoco' message never made it to the fireline. That was the tragedy.
There have been countless burnovers and close calls from thunderstorms. Hell, the dude fire did the same thing. Predictable is preventable. You you can count on a fire being unpreditable under such conditions. That's the thing. In the end it is predictable.
You can bet on the lack of acting on intuition which brought flam (sic) on there backs. Just like Mann Gulch and South Canyon. Assumptions of the person above you in rank or in other agencies who knows what they are doing and not wanting to question their actions. We will see.
WXMAN42 July 4, 2013 at 11:56 AM @RentonRebel
To explain and hopefully address my thoughts better I will try to clarify. Your initial comment appeared to be an attempt to take a tragedy and turn it into a political statement without knowing what the whole process is, how the system works and is set up, what actually happened on the ground on that day or how fiscal policy affects/doesn’t affect the situation.
Unfortunately there are a lot of assumptions being made by folks that don’t know what did or didn’t happen on the ground and that is a foolish place to go.
Even Cliff, whom I respect for all he has done with the NWS locally (Langley Hill radar) and nationally (pushing NCEP modeling efforts) and knows a lot about the inner workings of the NWS doesn’t understand how the NWS supports the firefighting agencies, either through the local weather office or hrough (sic) the IMET program. I say that based on the question he asked in the last paragraph “Were there any meteorologists working the fire? If not, why not?” If he understood the process and the working relationship between agencies, that question would not have been asked.
Everyone is assuming that the outflow was a “surprise.” At this juncture I’m not saying it wasn’t but this assumption is based on what? Your perusal of the information disseminated between agencies or the logs of all the briefings that might have taken place between the various agencies at work or amongst the fire fighters themselves? If folks 1500 miles from the scene can sit back and “see” what happened clearly why assume that the local folks that deal with this type of weather every season didn’t “see” it coming? A quick and dirty primer on the IMET program can be found in this article along with some information on the weather support that had taken place that day. It’s a good and worthwhile read. (http://www.climatecentral.org/news/incident-meteorologists-on-the-front-lines-of-wildfires-16189)
There are so many other factors that could have led to this tragedy such as underestimating the change in fire behavior (historically low fuel moistures, high fuel loadings, etc.) with the wind shift, safety zone issues, communication problems, extreme topography complicating the escape, etc. Without the proper information which none of us have, we can’t sit back and make blanket assumptions and statements about what happened.
One must also be careful about making blanket statements and assumptions about how fiscal policy affects or doesn’t affect the situation in the field. Local forecast offices are at the ready 24/7 t support the teams as needed and IMET support is there when needed as well, so “the ability to assist fire fighters in fires large AND small” exists and is in place and has not been impacted by the fiscal issues of late.
It would be best to let the investigation team do their work and discover what actually happened. Then, based on what they discover work toward solutions that will help prevent a similar tragedy in the future. Jumping to uninformed assumptions and conclusions is much more harmful than helpful. [An author comment is necessary here. Instead, what ensued was a Federally-funded SAIT-SAIR with a predetermined conclusion, i.e. “...no indication of negligence, reckless actions, or violations of policy or protocol.” In other words, they did everything right. So then, how is it possible to do everything right and kill 19 GMHS in one fell swoop?] Hopefully I have explained my thoughts and not inflamed which is not my intent.
Although your piece brings up very good points for the future of firefighting my gripe is that the BLM just stood around watching this fire at 8-10 acres on the first day and did nothing to put it out. Many friends who share Yarnell as home are now homeless and 19 valiant firefighters have perished. ["valiant firefighters? Really?]
This fire started Friday afternoon! Lightning struck on friday.
Anonymous July 5, 2013 at 1:04 PM @Gelyn According to early reports Arizona State Forestry took over the fire the next morning after the lightning came through. 2 crews,3 engines,2 air tankers and one egg beater where (sic) assigned by 10:00 am. Unless you have more solid info please share. If it was truly a BLM show for the first 24 hours, had command of initial attack and "willingly" held back resources through out the next burning period-----they have another South Canyon on their hands. Be careful with your words in the early stages of the investigation.
The Wildfire Lessons Learned Center ( http://www.wildfirelessons.net/Home.aspx ) has a searchable database (Incident Reviews) of wildfire incidents going back many decades. The reviews of past incidents (in this case "entrapment" or "burnover") are very detailed and contain critical assessments and recommendations. Unfortunately, that database contains far too many similar incidents of entrapment due to sudden, but predictable, wind shifts. As mentioned the Dude Fire (Walk Moore Canyon in Payson, Arizona 1990) was very similar in cause and result with six fire fighters trapped and killed by a sudden wind shift due to convective activity. As a result of that incident many changes were instituted to diminish the potential for entrapment due to sudden, and somewhat predictable, wind shifts. The Australian Rural Firefighting organization produced a video in 2000 (youtube http://www.youtube.com/watch?v=uMGuiv2SYeg) [They refer to it as the Dead Man Zone] that documents the dangers due to sudden wind shifts. They detail many tragic events that have occurred during wildland fires in Australia. My understanding is that video is a required training item for all US wildland fire fighters. It is hard for me to understand how, with the strict standards set for US wildland fire fighters, especially LCES, and the modern understanding of the effect of rapidly moving convective activity on wildland fires, especially in steep terrain with many closed drainages, how the Granite Mountain Hotshots were assigned the task that led them to their entrapment and how spot forecasts were not demanded by their superintendent, and how Yarnell Incident Command did not order their withdrawal when the convective activity moved so rapidly toward them. I am sure the Lessons Learned Center will do their usual good job of determining where the breakdown occurred in forecasting, or communicating, or on the ground decision making.
My condolences to all involved. will do their usual good job of determining where the breakdown occurred in forecasting, or communicating, or on the ground decision making.
[See this post on the WLF LLC - Why Has the Wildland Fire Lessons Learned Center Lost Its Ethical Compass Defending The Federal USFS-Funded June 30, 2013, SAIT-SAIR Conclusion of No Wrongdoing?'
( https://www.yarnellhillfirerevelations.com/post/why-has-the-wildland-fire-llc-lost-its-ethical-compass-defending-the-yh-fire-sait-sair ) ]
I second what WXMAN42 and Alaska Progressive Review put forth. I will add though, as additional information to the question of Fire Weather Watch and Red Flag Warning issuance...watches and warnings are issued by the NWS after coordination with the land management agencies, when both fuels and predicted weather indicate critical fire weather conditions. It is a joint decision. Excellent analysis, Prof. Mass. Go Dawgs
Aaron Troy Small July 11, 2013 at 8:39 PM @WXMAN42
Is there some reason that a direct comparison couldn't be made between this fire and the Dude Ck Fire (http://www.fireleadership.gov/toolbox/staffride/downloads/lsr11/lsr11_info_summary.pdf)? Sincerely, it appears that virtually the same situation occurred again, yet nobody had learned from the last one, so it was repeated.
The USDA Forest Service has to understand that when forecasted weather conditions show the risk of extreme fire behavior, it is going to be awfully hard to explain why people were exposed to it merely to protect property, despite the increased risk. No fire on extreme fire days is routine and no one should send crews in assuming it will be routine.
Occupational Health & Safety requires the provision of a safe work place. Any fire on extreme fire days is by definition, not a safe workplace. By all means, take risks if lives are at stake, even some risks if property is saveable, but on no account should risks be taken to save property or material that is shown by modeling to be unsaveable given the potential conditions.
The rest of the world has adapted to reality and imposed virtually those same restrictions upon firefighter managers (notably the UK, Canada & Australia). It is well past time that the US did the same. Anyone who willfully ignores the risk and flouts it, should be held to account, like any other manager, in the criminal courts.
i Cliff - I read through your material and it fit exactly what occurred in Colorado Springs last year. I happened to be on I-25 just north of the Springs when the fire jumped the mountain and came down into town. There was a storm at that moment causing airflow from west to east where as before the storm the airflow was south to north. The south to north airflow gave confidence to the people in the Springs that the fire would not affect them. The sudden shift in winds caught everybody off guard. Thankfully, no firefighters lost their lives. But, an unfortunate elderly couple were trapped and died in their home. I hope that the meteorological community becomes aware of the critical role they have to play in predicting forest fire activity. Thanks for your efforts.
It is God, not Satan, who controls the weather (Exodus 9:29; Psalm 135:6-7; Jeremiah 10:13).
God controls the skies and the rain (Psalm 77:16-19).
God controls the wind (Mark 4:35-41; Jeremiah 51:16).
God upholds and sustains the universe (Hebrews 1:3).
God has power over the clouds (Job 37:11-12, 16).
God has power over lightning (Psalm 18:14).
God has power over all nature (Job 26).
Consider now the July 2, 2013, Wasatch Weather Weenies (Discusses the weather and climate of the Wasatch Front and Mountains, western United States, and beyond.) (all emphasis is added unless otherwise noted) "Readers include aspiring and old-school atmospheric scientists, weather enthusiasts, powder snobs, and poor souls enrolled in classes taught by University of Utah Atmospheric Sciences Professor Jim Steenburgh. Many posts feature content or insights enabled by the support of the National Science Foundation, Office of Naval Research, NASA, NOAA, and the National Weather Service. Comments are encouraged and should be substantive, weather and climate-related, and approved for all audiences" post titled: "Weather and the Yarnell Hill Fire"
"This is a guest blog from Matt Jeglum, a PhD student at the University of Utah. Matt spent 5 years fighting wildland fires.
"By now most of you have probably heard about the 19 fatalities that occurred on the Yarnell Hill Fire, a wildfire about 90 miles northwest of Phoenix, AZ that has also burned at least 50 homes in the small town of Yarnell, AZ. The 19 firefighters killed constituted nearly an entire crew and makes the Yarnell Hill Fire the most deadly wildfire in the US since the Griffith Park Fire killed 25 firefighters in 1933. Many thnks (sic) go out to those firefighters who continue to risk their lives to save lves (sic) and property.
"With each major fatality wildfire, extensive investigations have led to increasing safety though (sic) improved equipment and tactics. Some of these investigations, including the investigation of the 1990 Dude Fire in Arizona, have included improvements to the way that fire weather information is forecasted and disseminated. Today every firefighter undergoes training to learn how weather and fire interact. Incident commanders can request a Spot Weather Forecast from the National Weather Service that is specific to the location of their fire. Large wildfires may even employ an on-site Incident Meteorologist (from the National Weather Service) along with several dedicated surface weather stations providing real time weather data across the fire area.
"Weather plays a major role in firefighters' ability to control a fire, and the Yarnell Hill Fire was no exception. Two publicly available weather stations exist near the Yarnell Hill Fire, and the time series for one of them, Stanton, is shown below."

"The above plots show that on Sunday afternoon the fire area was subject to temperatures near 100 F, relative humidities in the teens, and wind fro[m] the southwest with gusts into to 20's. This caused the fire to move to the northeast at about 1/2 mile per hour according to some sources. From the limited information currently available, the Granite Mountain Hotshots were working on the south side of the fire on Sunday afternoon and probably expected the fire to keep moving to the northeast. However, as the afternoon progressed widespread thunderstorms popped up across the northern half of Arizona, moving in a southwesterly direction."

"Looking at the above image from the Flagstaff, AZ weather radar one can see these thunderstorms along with numerous outflow boundaries."

"Outflow boundaries frequently accompany thunderstorms in the Southwest US and can be diagnosed by looking at weather balloon soundings of the atmosphere. The above sounding was taken at 6 pm Sunday in Flagstaff, AZ. The line on the left is dew point and the one on the right is temperature. The further apart these lines are, the dryer the air is att that altitude. You can see that the moisture supporting the thunderstorms is in the mid-levels of the atmosphere, while the lowers levels (sic) (below 550 mb) are very dry. In Arizona on Sunday, precipitation falling from the thunderstorms "partially or completely evaporated in this dry air and in doing so cooled the air. This cool air, being more dense than the surrounding air, sank rapidly until hitting the ground and fanning out. After hitting the ground the cool air can travel many miles horizontally, producing dramatic changes in wind speed and direction as it passes by a given point. This is the critical aspect of the weather that led to the tragedy at Yarnell Hill."

"Looking back at the Stanton station, between 5 and 6 pm (1700 and 1800 on the above plot) the outflow boundary from the thunderstorm to the northeast of the fire hits the station. It probably hit the fire just minutes before. The wind switches to northeasterly and the gust speed doubles to nearly 45 mph, with sustained winds near 25 mph. A slight drop in temperature and rise of relative humidity is seen as the boundary passes, consistent with an outflow, but temperatures stay in the mid-90's with humidities still in the teens. This is a perfect storm. With the strong, northerly wind pushing it, the fire completely switches direction and starts burning furiously toward the Granite Mountain Hotshot crew, who are on the south side of the fire at this time. There was probably very little time to react.
"As a former forecaster and former firefighter, I can appreciate the issues faced by both sides when it comes to forecasting, disseminating, and using weather information to fight fires. Conditions like this were certainly foreseeable the morning before the accident. However, predicting where thunderstorms will form and where outflow boundaries will go, if there are any, is extremely difficult outside of a realm of foecasting (sic) called nowcasting. Nowcasting involves making forecasts on the order of hours to minutes based mainly on extrapolating forward the currently observed conditions. It is very useful for weather conditions such as those experienced on the Yarnell Hill Fire, but is very labor-intensive and impractical over large areas.
"There are no doubt many factors a play in causing a tragedy like this. Even the influence of the weather still remains to be fully understood. Hopefully the Yarnell Hill Fire will provide an opportunity to make firefighters safer as they protect lives and homes from wildfires."
It will be worth reading the one educated, informed, knowledgeable and germane comment - Jeff says (13 July 2013 at 1:37):
"Good information and good work.
This tragic event was clearly predictable and preventable once we focus on the wildland firefighting rules.
Several of the Common Denominators to tragedy fires were in place: (1) light, flashy fuels, (2) isolated sectors of large fires,(3) in or adjacent to chimneys, chutes, or bowls, and (4) unexpected shifts inw ind direction or wind speed.
The primary Ten Standard Fire Orders relevant were: (1) Keep informed on fire weather conditions and forecasts, (2) Know what your fire is dong at all times, and (3) Base all actions on current and expected fire behavior.
Several of the 18 Situations that shout Watch Out applied: (11) Unburned fuel between you and the fire, (14) Winds increases and/or changes direction, and (17) Terrain and fuels make travel to safety difficult.
Several of the Look Up, Down, and Around fire environmental factors and indicators applied listed in the Incident Response Pocket Guide on pages 2-3.
Hopefully, this will help to prevent further tragedies. May God be with the families, friends, loved ones, and those firefighters also involved."
By Jason Samenow
July 1, 2013 at 12:10 p.m. EDT Washington Post
The Arizona Republic News Staff was recognized as a 2014 Pulitzer Prize Finalist in Breaking News Reporting: "For its compelling coverage of a fast-moving wildfire that claimed the lives of 19 firefighters and destroyed more than a hundred homes, using an array of journalistic tools to tell the story." (emphasis added)
This website is a good one to check out with several written articles and images and texts from WFs, FFs, and others engaged in the YH Fire. This is where I first became aware of the Yarnell, AZ slogan that truly smacks of cautionary fire weather: "Where A Desert Breeze Meets The Mountain Air." One that the GMHS, being pretty local and all, acted and performed much more as a non-local Resource triggering Watch Out No. 4 - "Unfamiliar with weather and local factors influencing fire behavior."
One of my all-time favorite YHFR posts about that GMHS issue is the June 24, 2019, "Why is it that a group of 'Hybrid' Firefighters from the Sun City West Fire Department successfully and judiciously noticed the increased June 30, 2013, late afternoon fire behavior, and then proactively disengaged, but the Granite Mountain Hot Shots (GMHS) perished because they did neither?"


Figure 4. June 2013 YH Fire coverage Nominated Work page of topics covered (left) and idealized images (right) of the June 30, 2013, fire weather wind shifts by the AZ Republic for a 2014 Pulitzer Prize Award. Source: AZ Republic
What follows are two similar, yet separate and distinct wildland fire weather research papers that are extremely informative, however, they are both quite complex for those unversed in Meteorology. In other words, you may well be in over your head through most of them requiring you to read them several times. And that is okay. In fact, specifically regarding these wildland fire weather YH Fire research papers, one retired NOAA National Weather Service (NWS) meteorologist told me that there needs to be a way for us to "make it more operational" so that on-the-ground WFs, FFs, IMTs, and regular citizens can actually better understand and then apply the new-found research.
Atmospheric Scientist Dr. Michael Kaplan works at the Prescott, Arizona Embry-Riddle Aeronautical University (ERAU), and his contact information is included in the paper. He is more than willing to field questions and is good about returning email correspondence.
Consider now the 2021 research paper Abstract, Introduction, and very briefly the Methodology portion. You will have to follow the respective links to get to the actual papers. The 2022 research paper will follow immediately afterward in the same format. You will notice that there will be numbered Figures in these research papers that are to be considered as stand-alone for those papers only unless otherwise noted.
(1) Kaplan, M.L., C. N. James, J. Ising, M. R. Sinclair, Y.-L. Lin, A. Taylort, J. Riley, S. M.S. Karim, and J. Wiles, 2021: The Multi-Scale Dynamics Organizing a Favorable Environment for Convective Density Currents That Redirected the Yarnell Hill Fire. Climate, (https://doi.org/10.3390/cli9120170)
(2) Ising, J., M. L. Kaplan, and Y.-L. Lin, 2022: Effects of density current, diurnal heating, and local terrain on the mesoscale environment conducive to the Yarnell Hill Fire: Atmosphere, 2022, 13, x. (http://doi.org/10.3390/atmos13020215)
2021 The Multi-Scale Dynamics Organizing a Favorable Environment for Convective Density Currents That Redirected the Yarnell Hill Fire Abstract: "The deadly shift of the Yarnell Hill, Arizona wildfire was associated with an environment exhibiting gusty wind patterns in response to organized convectively driven circulations. The
observed synoptic (>2500 km) through meso-β (approximately 100 km) scale precursor environment that organized a mid-upper tropospheric cross-mountain mesoscale jet streak circulation and upslope thermally direct flow was examined. Numerical simulations and observations indicated that both circulations played a key role in focusing the upper-level divergence, ascent, downdraft potential, vertical wind shear favoring mobile convective gust fronts, and a microburst. This sequence was
initiated at the synoptic scale by a cyclonic Rossby Wave Break (RWB) 72 h prior, followed by an anticyclonic RWB. These RWBs combined to produce a mid-continent baroclinic trough with two short waves ushering in cooler air with the amplifying polar jet. Cool air advection with the second
trough and surface heating across the Intermountain West (IW) combined to increase the mesoscale pressure gradient, forcing a mid-upper tropospheric subsynoptic jet around the periphery of the upstream ridge over Southern Utah and Northern New Mexico. Convection was triggered by an unbalanced secondary jetlet circulation within the subsynoptic jet in association with a low-level upslope flow accompanying a mountain plains solenoidal circulation above the Mogollon Rim (MR) and downstream mountains."
"Keywords: density current; Rossby Wave Break; jetlet; downdraft convective available potential energy; microburst; wildfire; ageostrophy"

Figure 4a. (a) Yarnell Hill fire progression during 0600 MST 29 June–0600 MST 1 July 2013 (from Karels and Dudley 2013) and (b) the percent of normal precipitation for parts of Arizona, New Mexico, and Southeastern California valid at 1357 UTC 2 July 2013 for the water year beginning on 1 October 2012 (Note: black diamond for Yarnell; NWS Flagstaff).
"1. Introduction. June 2013 was a remarkable month for weather in Arizona, the fourth-hottest June ever recorded up to that time. This also represented a period of prolonged drought in the Southwest U.S. The last week of June was the hottest week of what was to be a hot summer, with numerous daily high temperature records set for the 30th, e.g., 39°C at Prescott (KPRC) located at approximately 1600m above sea level (ASL) and approximately 60km northeast of Yarnell. Temperatures on 30 June approached and/or exceeded 38°C at the Stanton and Peeples Valley Remote Atmospheric Weather Stations (RAWS) only a few kilometers from Yarnell (Office of the State Climatologist 2013: Summary of Conditions for June 2013, not shown). The Stanton and Peeples Valley RAWS both confirm a significant wind shift from the southwest and west to the north–northwest and north–northeast, respectively, close to the time of the YHFT between 1600 and 1700 MST (2300 and 0000 UTC). Figure 2b emphasizes the ongoing drought conditions in the southwest, particularly in Arizona at the beginning of July 2013. Most of the state was in a precipitation deficit approaching or even exceeding 50% for the 2013 water year, which began the previous October. Yarnell was in the middle of the 50–75% deficit region up to July 2nd for the 2013 water year, as depicted in Figure 2b, while Northwestern Arizona exceeded a 75% deficit. These observations, as well as others across the entire western and northern regions of the state, extreme drought conditions favorable for substantial diurnal surface sensible heating."
Consider this post Figure 4b. below depicting the US Drought Monitor map for AZ for June 25-27, 2013, because this author believes that it is a much better representation of the drought with Yarnell denoted by a black star.

Figure 4b. US Drought Monitor for AZ June 25-27, 2013 Source: NOAA (2018)
"This extreme heating is exemplified at Stanton, AZ, with an observation of 38°C at 10:01 MST in response to a surface sensible heat flux of approximately 756 Wm−2 [4].
"Yarnell is situated within a group of complex terrain features, including a local valley and a terrain gap. While Yarnell is situated in a narrow gap between low rolling hills (Figure 1b), much more extreme topography exists regionally to the east–northeast and immediate southwest (Figure 1a). To the east–northeast is a sequence of terrain features extending well above 2000 m MSL, including, sequentially, the Bradshaw Mountains, Black Hills, and Mogollon Rim (MR) (approximately 30,75, and 150 km from Yarnell, respectively). Deep valleys exist between the Bradshaw Mountains and Black Hills, as well as between the Black Hills and MR, including Prescott Valley and Verde Valley, respectively. The Colorado Plateau (CP) is located to the northeast of the MR. Approximately 5km to the immediate southwest of Yarnell, as [a] sharp drop in topography approaching 1000 m in approximately 2km separates the Western Arizona low desert region and Central Arizona’s high semi-arid terrain. On the immediate western–northwestern and eastern sides of Yarnell are the Weaver Mountains. Hence, meteorological features propagating from a variety of directions would encounter substantial variability in the complex terrain elevation near Yarnell.
"The convection associated with the YHFT occurred early in the summer. The National Weather Service (NWS) provided adequate forecasting support, and real-time forecasts of the event by the High-Resolution Rapid Refresh (HRRR) model were also generally representative of the weather hazards. Both indicated the possibility of gusty surface convective outflows [5]. The gusty surface winds could exacerbate wildfire danger in a dry hot region such as Central Arizona. Our research motivation is not to review the forecasts of the event but, rather, to understand in detail the larger-scale influences and downscale dynamical organizational processes causing the shifting gusty winds leading up to the YHFT.
"Severe convection in Central Arizona has not been extensively analyzed in the literature with this goal in mind. One could separate this literature into three general categories: (1) in-depth observational climatologies of convective events,(2) regional simulations of seasonal climate and their relationship to the North American Monsoon (NAM), and (3) individual severe convective event observational analyses. The first category entails climatologies of severe convection and/or flooding rainfalls [6–8]. Most seminal is the study by Maddox et al. [6] that found three types of synoptic-scale environments favorable for severe weather in Central Arizona; however, they also pointed out that there is often ambiguity relating these environments to reliable real-time forecasting of severe weather. Furthermore, at the time of their climatological study, operational reanalyses were limited in scale to meso-α and greater, thus lacking mesoscale details critical in the complex geography of Central Arizona. The more contemporary and observationally comprehensive climatological studies of Mazon et al. [7] and Yang et al. [8] were largely focused on synoptic-scale predictive indices involving static stability, water vapor, and geopotential height fields. Again, these represent broadscale predictive signals of large numbers of heavy rainfall or severe convective events without in-depth mesoscale details.
"The second category involves employing regional simulation models to diagnose seasonal trends in the response of the NAM to forcing functions that control climate variability [9,10,11]. This type of study only deals with seasonal dynamical processes not individual case study multiscale processes. Finally, the third category, which has been quite rare, is that focusing on a single intense convective event [12,13]. McCollum et al. [12] analyzed the “surprise” 23 to 24 July 1990 Southwest Area Monsoon Project (SWAMP) extreme rainfall event in Phoenix, where few, if any, downscale dynamical linkages from the synoptic to mesoscales were unambiguously identified, given the lack of upper air observations. The surface and radar data were substantial and analyzed in depth but not high-resolution rawinsondes or numerical simulations. In another manuscript recently submitted on the Yarnell Hill Fire, Ising et al. [13] demonstrated how the general evolution of the key density current features from the MR to Yarnell were dependent on evaporational cooling, surface sensible heating, and the unique terrain structure near Yarnell. We will show some of these results in this manuscript as well, in so far as they support the density current evolution. Finally, there have been comprehensive studies of terrain-induced convection, such as those performed during the Cumulus Photogrammetic, In-situ, and Doppler Observations (CuPIDO) campaign in the Santa Catalina Mountains of Southeastern Arizona, as published in Damiani et al. [14] and Demko et al. [15]. These studies focus primarily on local convective initiation rather than severe convection resulting from downscale dynamical organizational processes. Analyses of downscale forcing in Central Arizona are relatively unique.
"In this study, we will address this cascading multiscale set of processes with a focus on the meso-β scale and provide evidence that may aid in linking these circulations that provided an environment favorable for convective forcing near the YHFT. This study is presented with an understanding that the literature on density currents and multiscale convection is extraordinarily rich. The studies by Carbone et al. [16], Wakimoto [17], Rotunno et al. [18], Xu and Moncrieff [19], Liu and Moncrieff [20,21], Xue et al. [22], and Moncrieff and Liu [23], among others, supported the importance of significant along-stream vertical wind shears in the multicellular storms that generate long-lived gravity or density current outflows. Moncrief and Liu [23] performed numerical experiments indicating the importance of downshear forcing in producing density currents with deep ascent zones favorable for creating continuously regenerating convection. The focus of the study presented herein is intended to represent the synoptic-to-meso-β-scale components in the development of a paradigm of dynamical processes linking the planetary to the storm scale, including the generation of upper-level divergence, thermally direct upslope circulations, and low-level vertical shears at the meso-β scale, thus extending the previous research findings described above.
"Section 2 of this manuscript represents a summary of the observational and numerically generated datasets used in the analysis. In Section 3.1, we will employ primarily synoptic and regional-scale observational analyses (synoptic-to-meso-α scale) to diagnose the precursor circulations that established a convectively favorable meso-β-scale environment. Section 3.2 will focus on the mass and momentum adjustments at the meso-β scale that led to ascent and vertical wind shear conducive to multiscale convection and density currents. Section 3.3 will depict the observed radar indicating the evolution of organized convection, as well as simulated wind perturbations in the PBL resulting from the convection. We will summarize our results in Section 4.
"2. Methodology
We employed observational and numerically generated datasets in this study to describe the state of the synoptic-to-meso-β-scale atmosphere both over and upstream of Central Arizona to diagnose the environment favorable for the convectively forced wind systems responsible for the YHFT."
At this juncture, what follows is the 2022 research paper that refers to virtually "removing the mountain" to explain the complex terrain's influence on fire behavior.
"(2) Ising, J., M. L. Kaplan, and Y.-L. Lin, 2022: Effects of density current, diurnal heating, and local terrain on the mesoscale environment conducive to the Yarnell Hill Fire: Atmosphere, 2022, 13, x. http://doi.org/10.3390/atmos13020215
Additionally, they note the similarities to the June 1990 Dude Fire near Payson, AZ, and even cite one of our Applied Human Factors and Ergonomics (AHFE) papers on Human Factors (Schoeffler, M.; Honda, L.; Collura, J.A. How Many Human Factors Influenced the 30 June 2013, Yarnell Hill Fire 19 Fatalities and Yet Were Never Investigated Nor Documented? In Advances in Safety Management and Human Performance; Springer International Publishing: New York, NY, USA, 2021; Volume 262, pp. 115–123. [CrossRef]
"Abstract: The Yarnell Hill Fire, triggered by dry lightning on 28 June 2013, was initiated by hot and dry westerly winds, which rapidly shifted to north-northeast by convective-induced outflows. This sudden wind shift led to the demise of 19 firefighters. This study focuses on the environment and its predictive potential in terms of erratically changing the fire spread. Three numerical sensitivity tests are performed investigating the evolving synoptic-meso-βscale environmental wind flow: (1) deactivating the evaporative cooling, (2) deactivating surface-driven diurnal heating/cooling, and (3) removing the mountain. Results show the strong north-northeasterly wind induced by the density current(s) and the diurnal surface sensible heating played the most significant roles in enhancing the mesoscale environment conducive to the rapid change in the fire spread direction. While the mountain played a less significant role in weakening the magnitude of the airflow affecting the fire, it still had an impact. Additionally, the Hot-Dry-Windy (HDW) index is calculated to determine its predictor role with respect to the atmosphere affecting the fire. The focus is not on feedback from explicit fire heating on the larger environment but rather the role of the environmental physical processes in causing the convectively induced rapid wind shifts.
"Keywords: Yarnell Hill Fire; density current; diurnal heating; complex terrain; numerical modelling (sic); Advanced Research Weather Research and Forecasting (WRF) mode
"1. Introduction
On Friday, 28 June 2013, a lightning strike from nearby convection triggered a small bush fire in west central Yavapai County, Arizona, just to the west of Yarnell, in a region known as the Yarnell Hills. A map of where Yarnell is located as shown in Figure 1.
On Sunday, 30 June 2013, during the early afternoon hours, convection built up between Flagstaff and Prescott. By mid-afternoon, this convection had developed into a northwest-southeast oriented squall line near Dewey-Humboldt (~20 km southeast of Prescott). The squall line generated a density current, which over the next hour, raced
southwestward toward Yarnell. By about 1630 MST (2330Z), the density current arrived at the Yarnell Hills region and created a sudden shift in the fire direction from moving eastward, then to the south, and then southwestward (Figure 2 [1]). This sudden shift in the fire direction overcame and trapped 19 firefighters (Granite Mountain hotshots)
battling the flame on the western front, which led to their unfortunate demise. The fire environment at the time was exceptionally hot and dry. Fire danger was high to extreme because of extreme drought conditions during the transition to the southwest monsoon summer season. During this seasonal transition, temperatures are typically hot. The relative humidity values remain low but fluctuate as storms become more numerous. The winds are highly variable with the highest wind speeds occurring during thunderstorms. These storms can generate strong downdrafts, microbursts, outflows, and gust fronts, all of which can affect fire behavior.

Figure 4c. Snippet of 2002 Ising, Kaplan, Lin paper Figure 1. See their caption content within the Snippet image. Source: Mesolab.US
"Wind affects fire by removing moisture from the air, igniting new fires through fire-brand transport, and increasing oxygen supply. The biggest effect of wind is on the change in fire spread direction and rate [2] which many studies have examined [3–8]. Wind shifts affecting fire spread, such as in the Yarnell Hill Fire, were also observed in the Honey Fire that increased personnel risk and fire intensity [9], and in the Bass River Fire which led to fatalities [10]. Although not the focus in this study, synoptically induced severe downslope winds can affect fires near high elevations such as the Camp Fire [11], Witch Fire [12], and the Thomas Fire [13]. The numerical modeling in these studies has had mixed results
when compared to observations. In the Dude Fire, model results closely resembled the observed fire behavior, and in the Waldo Canyon Fire, the gust fronts were simulated but the timing was 2 h too early. In the burn over incident at the St. Sebastian River Preserve [Fire] and in the Bass River Fire, the weather forecasts and numerical modeling did not predict the wind accurately when compared to observations. In the Camp Fire, models performed decently with some surface observations. However, non-standardized practices led to poor performance with two commercial weather stations. These studies have indicated that the unpredictability and poor understanding of fundamental dynamical processes at the complex terrain scale of local wind strength and direction makes the numerical prediction of these winds and wind surges challenging, especially on small time scales as in the Yarnell Hill Fire. Thus, it is critical to study more fires where the wind played a vital role to improve fire weather prediction, create increased public safety, and reduce loss of
life and property. Previous studies involving the Yarnell Hill Fire have not focused on the role of the environmental physical processes such as the density current generation and it is strengthening/weakening. There have been studies that investigated human factors such as the chain of error [14] and the decision-making process, communication, and dynamic flows of information, in which limitations of standard practices in the dangerous wildfire conditions were, discovered [15]. A study from the University of Berkley has also looked at the Yarnell Fire in part to determine whether fire station infrastructure is suitably placed such that areas of the highest wildfire risk are protected using a Geographic Information Systems approach [16].
Other studies have examined fire propagation and its complexity [17] and developed a novel model for fire evolution [18]. Neither study examined the thunderstorm outflow."
Consider below an idealized image of thunderstorm outflow winds

Figure 5. Idealized image of thunderstorm outflow winds Source: Chapter 15: Thunderstorm Hazards. Public Domain
"Additional previous research on the Yarnell Hill Fire has focused on broader gust front characteristics through in situ observations with specific applications toward aviation [19].
This study found that wind speed, relative humidity, turbulent kinetic energy, and vertical motion increased while temperature decreased as the gust front passed. However, this study did not investigate the origins of the Yarnell [Fire] gust front nor how the environment enhanced the Yarnell [Fire] gust front, and its implications toward the fire shift (direction and intensity).
"A recent observational study of the Yarnell [Fire] case [20] analyzed the downscale organization of convection from the synoptic to meso-beta scale. However, our approach is unique because it employs model sensitivity studies at the meso-beta/gamma scale. Another study has researched cooling in a dry surface layer by looking at downdraft maximum available potential energy (DCAPE) and expanding this through a climatological analysis (seasonal and diurnal patterns) [21]. Finally, another recent study has led to the development and implementation of a software tool that identifies and depicts convective outflow boundaries in high-resolution numerical weather prediction models to provide guidance
for fire weather forecasting [22]. For the DCAPE investigation, the focus is only on one aspect of the gust front and how it changes in the long term. For the software tool, while useful, the research does not directly investigate the outflow boundary interaction with other phenomena in complex terrain (like with the Yarnell Hill Fire) nor isolates the most
important enhancement factors. Prior research on Yarnell [Fire] [17–22] has shown that the numerical prediction of wind surges remains challenging because of the lack of understanding of fundamental dynamical processes at the complex terrain scale. Improving the understanding of multi-scale atmospheric processes that control the motion and longevity of extreme fire events is vital.
The study presented here will help answer questions such as: Which factors were the most important toward the density current generation and propagation? What impact, if any, did the isolated mountain to the southeast of Yarnell have on the density current direction and intensity?"
The author places this excerpt and relevant Ising, Kaplan, and Lin (2022) Figure 3. image directly below regarding "removing the isolated mountain" listed on page 6 of 31 and page 7 0f 31, respectively of this research paper because it is not included in the cut-and-paste excerpts; and because it is considered an amazing piece of insightful research to delve into this terrain factor influence. "Four simulations including three sensitivity tests were conducted to examine the density current generation, propagation, and interaction through the complex terrain. Initially, a control case (CNTL) was run for comparison, then the southeast Weaver Mountain (NSEM) was removed to study the blocking effects. Afterward, evaporative cooling was turned off (NEVP) to investigate the importance of latent heat change effects. Finally, the last sensitivity test involved turning off the diurnal surface sensible heating to examine the importance of convective instability building during the day (NDHT)."

Figure 6. Relevant Ising, Kaplan, and Lin Figure 3. indicating simulated terrain removal Source: Ising, Kaplan, and Lin (2022)
"Can a fire index predict the change in the fire environment? Lastly, what
role did evaporative cooling play?
"Seldom has the Yarnell Hill Fire gust front, its origins, the strengthening / weakening factors, and the associated atmospheric processes been addressed in published literature.
"The research presented here focuses on filling this gap to better understand how the density current was organized by its environment, which includes the Yarnell Hill Fire.
"A density current, or gravity current, is a region of dense fluid that moves into an environment of less dense fluid because of horizontal pressure gradient differences across a frontal surface [23]. In some cases, this density difference has been found to be smoke-induced [24]. There are different types of density currents that can exist depending on the environment. For example, density currents can occur with sea-breeze fronts [25], cold fronts [26], drylines [27], and can also be associated with an outflow from a thunderstorm [28,29]. Researchers have studied thunderstorm outflow density currents in-depth and have found bore-like disturbances [30,31] as well as solitary waves [32]. Others have looked at density currents in the scope of numerical modeling and have found that, for example, while shear decreases the horizontal convergence because of the downshear-propagating density current, it is nevertheless fundamental to the dynamical organization and depth of the density current [33]. Dynamical models have also been employed focusing on the role of stably stratified flow and cooling in density current organization and motion [34,35].
"In the sense of affecting the fire environment, a density current is fundamentally different from a severe downslope wind event such as the Santa Ana winds in California.
"This wind event is generated by high pressure over the southwest U.S desert that flows westward toward a low pressure off the coast of California. Santa Ana winds increase wildfire risk from the dryness and speed of the winds, which are amplified and heated by downslope adiabatic heating along the coastal mountain lee slopes [36]. The time scale
of the Santa Ana winds is on the order of days [37] and can be predicted up to a week in advance [38], whereas a density current is on the order of hours [39] and can only be predicted minutes to hours in advance as it relies on the parent thunderstorm stage [40].
"In the Yarnell [Fire] case, the density current moved from the northeast to the southwest into an environment with significant vertical wind direction shear. Near the fire, this created a sudden shift in wind direction and change in intensity (Figure 2). The wind changed from moving east to south, and then southwest and increased from ~10 to ~20 ms−1. The density current changed the direction and speed of the wind ahead of it.
"Diurnal surface sensible heating is an important factor for the generation of thunderstorms over land. Significant diurnal variations can be found globally, particularly over land and during summer. Thunderstorms occur much more often during the late afternoon over land in all seasons. This is because solar radiative heating during the day on the ground generates a late-afternoon maximum of convective available potential energy (CAPE) that is favorable for late-afternoon moist convection [41]. In July over Arizona, CAPE arises from a high moisture tongue that comes from either the Gulf of California, Mexico, or the Gulf of Mexico into the western United States, with maximum values in the late afternoon to early evening over much of the land area. The solar-driven cycle of surface pressure results in significant large-scale convergence over most of the western
United States during the day, which includes Arizona. During the nighttime, the maximum thunderstorm activity occurs east of the Rockies, which is fueled by the eastward propagation of late afternoon thunderstorms generated in the west [42]. It is hypothesized that
diurnal heating (in the context of this research, referring to the diurnal heat flux) plays one of the most significant roles in the generation of the thunderstorm, and in extension the outflow/density current, that rushed through Yarnell.
"The North-Central Arizona terrain presents an excellent environment for studying atmospheric events [43]. The terrain around the Yarnell Hills is complex, consisting of small mountains, valleys, and plateaus. The Yarnell region is elevated and Yarnell sits within a terrain “bowl”, surrounded to the west, south, and east by the Weaver Mountains. Yarnell sits at roughly 1400 m above mean sea level with the highest peak of the Weaver Mountains rising to 2000 m, creating an elevation difference of about 600 m. To the south immediately beyond the Weaver Mountains is an escarpment that drops 500 m (1400 m minus 900 m) vertically over a horizontal distance of 3500 m. Just beyond the Weaver Mountains to the
east lies a northwest-southeast oriented valley at 1000 m above mean sea level. The terrain remains relatively flat toward the northeast up to the Bradshaw Mountains, and beyond lies the Verde Valley with an elevation minimum of about 1200 m. The Verde Valley borders the Black Hills to the northeast and is followed by the Mogollon Rim, which forms the southern edge of the Colorado Plateau (Figure 1b).
"Flow in and over complex terrain is multi-faceted. However, it has been found that surface flow characteristics are highly dependent on terrain slope, where the greatest difference in flow appears in regions behind the top of hills [44]. For example, for winds with larger flow/magnitudes, forcefully channeled strong ambient wind will lead to local winds
almost perpendicular to the ambient winds. For winds with smaller flow/magnitudes, thermal effects drive local winds [45].
"Additionally, thermo-topographic flows arise from differential heating [46] and affect wind through speed-up over ridges, flow channeling in valleys, flow separation around terrain obstacles [47], and generation of lee-side vortices parallel to mountain ridges [48].
An isolated mountain can have different effects on the ambient wind. "Thermal variations create small-scale wind circulations such as a valley breeze during the day and a mountain breeze at night [49]. Additionally, wind increases with height and mountaintop winds are twice as high as surrounding low-altitude wind speeds [50]. Other effects include
blocking [51] and strong downslope winds in the northern half of the lee of a ridge [52]. It is hypothesized that the role of complex terrain may aid in the divergence and blocking of local wind.
"In the following sections, Section 2 will cover the model description and experimental design, which includes a discussion of the Hot-Dry-Windy index. Section 3 will present the observational analysis and model validation, simulated density current generation and propagation, effects of diurnal heating and evaporative cooling, effects of complex terrain,
and density current interaction. Section 4 will conclude with a summary of the results and additional remarks including future work."
Consider now the highly controversial subject of replacing the long-standing Haines Index and the proposed replacement called the Hot-Dry-Windy Index (H-D-W) in an NWCG article (2021) titled: Critical Weather and a Wildfire Today article (June 10, 2022) on the subject - Why are we still using the Haines Index?


Figure 7. Snippets of Don't Use the Haines Index Part 1. Description and Overview (left) and 5.1 Part 2: Stability (and the fact that instability is not part of the Haines Index) (right) videos Source: South Dakota Meteorologist Darren Clabo and Wildfire Today
This is the end of (2) Ising, J., M. L. Kaplan, and Y.-L. Lin, 2022: Effects of density current, diurnal heating, and local terrain on the mesoscale environment conducive to the Yarnell Hill Fire: Atmosphere, 2022, 13, x. http://doi.org/10.3390/atmos13020215
Consider now some NOAA NWS Weather Safety and ensuing fire behavior definitions often encountered during wildfire seasons.
"Understanding Wildfire Warnings - Red Flag Warning: Take Action. Be extremely careful with open flames. NWS issues a Red Flag Warning, in conjunction with land management agencies, to alert land managers to an ongoing or imminent critical fire weather pattern. NWS issues a Red Flag Warning when fire conditions are ongoing or expected to occur shortly.
Fire Weather Watch: Be Prepared. A Watch alerts land managers and the public that upcoming weather conditions could result in extensive wildland fire occurrence or extreme fire behavior. A watch means critical fire weather conditions are possible but not imminent or occurring.
Extreme Fire Behavior: This alert implies a wildfire likely to rage out of control. It is often hard to predict these fires because such they (sic) behave erratically, sometimes dangerously. One or more of the following (enumerated to save space) criteria must be met: (1) Moving fast: High rate of spread; (2) Prolific crowning and/or spotting; (3) Presence of fire whirls; (4) Strong convection column"
Obviously one cannot "see" the wind, however, WFs and FFs use other indicators such as clouds or smoke as seen below in Figure 8.

Figure 8. photo of June 30, 2011, NM Santa Fe NF Las Conchas Fire rotating smoke vortices preceding similar fire behavior characteristics resulting from winds. Source: Lubbockonline.com

Figure 9. Depticting Kaplan et al (2021) Figure 9. http://weather.rap.ucar.edu/upper/) Skew-T/log-P radiosonde soundings at (a,b) Santa Teresa, New Mexico (EPZ) and (c,d) Albuquerque, New Mexico (ABQ) valid at 0000 UTC and 1200 UTC 30 June 2013. Source: Kaplan et al (2021)
Utilized by pilots, hang-gliders, para-gliders, and such, Skew-T diagrams like this Glasgow, MT image below from Air Facts Journal will allow you to see how the temperature and amount of moisture in the air changes as you rise and descend through the atmosphere and thus assist you with interpreting and understanding what you are seeing in Figure 5. above.

Figure 10. Glasgow, MT Skew-T image Source: AFJ
These are a few fairly helpful sources about Skew-T diagrams. The NWS Skew-T website link will allow you to explore the various diagram elements separetely. The COMET Program after signing up for a free MetEd UCAR account and the Penn State Atmospheric Sciences METEO 300 Course "3.5 The Skew-T Diagram: A Wonderful Tool!" are both very useful.
""Lines of equal temperature are skewed at a 45-degree angle along the 45-degree horizontal axis and pressure in millibars is plotted on a logarithmic scale along the vertical axis. As we will soon see, meteorologists overlay temperatures, dewpoints, and wind barbs on this diagram to make thermodynamic calculations easier.
We can easily identify levels of the atmosphere that are saturated, where the temperature and dewpoint are equal to each other and where clouds are likely to be or form. This is particularly helpful for higher altitude pilots, as a sounding shows the depth of saturated (lines closer together) and drier layers (lines further apart) and thus layers where clouds are more or less likely to be.
"Wind barbs on the Skew-T Log-P diagram not only show you winds aloft but also allow you to easily see wind shear. Higher directional and speed shear suggests convection is more likely to be organized.
"Lastly, we can easily see inversions, or where temperature increases with height, on a sounding. Inversions are important for the formation of thermal belts, fog, and can inhibit thunderstorm development.""
Consider now the Meteograms for Farmington and Gallup, NM, and Prescott, AZ for June 30, 2013, included in Kaplan et al (2021).

Figure 11. Kaplan et al (2021)various surface meteograms [24] at (a) Gallup, New Mexico (KGUP), (b) Deming, New Mexico (KDMN), (c) Farmington, New Mexico (KFMN), and (d) Prescott, Arizona (KPRC) representing the entire period from 0000 UTC to 2300 UTC 30 June 2013. Source: Kaplan et al (2021)
A fairly detailed explanatory description of the meteorological variables in the Figure 11. meteogram which gives you a week-long data set is given below. Source: Weather and Climate George Mason Univ.
"Tropospheric Time-Height Cross Section
""Winds, temperature, and relative humidity in the lower troposphere (up to ~500 millibars) are shown in the profile. The model data we receive is interpolated down to 1000 millibars, but over high terrain, only data that is near or above ground level is displayed. Data below ground level has no physical meaning and is omitted.
"The wind barbs indicate the direction and speed of the wind, rounded to the nearest 5 (mph or m/s). A full barb = 10, and a short barb = 5, and a pennant = 50. The speed can be found by tallying the barbs. The barbs project into the wind -- they point to the direction the wind is coming from. A stem pointing left with one full barb and one-half barb indicates a wind from the west at 15.
"The colored contour lines indicate the profile of temperature, in °F or °C. The contour interval is 10°F or 5°C. The freezing level is indicated by the double black line labeled FR.
""
The graduated green shading indicates relative humidity.
1000-500 mb Thickness
Thickness is the vertical distance between two pressure levels. In general, it is true that the distance will be a function of the density of the air between the two pressure levels, which is itself directly related to the temperature of the air. Thus, thickness is a good indicator of the mean temperature in the layer of atmosphere between the two levels -- greater thickness = warmer air.
"The cyan line shows the thickness of the 1000-500 millibar layer of the atmosphere. This is approximately the bottom half of the atmosphere (except over high terrain). The units are dekameters (10s of meters, 10 meters is about 33 feet). One rule of thumb is that if the thickness of this layer is less than 540 dm, that any precipitation will be in the form of snow.
"Sea Level Pressure
Sea level pressure (SLP) is the surface pressure interpolated down to sea level from the altitude of the grid box of the model. This corresponds to the barometric pressure one hears reported on local radio or TV weather reports. The dark blue line indicates SLP in millibars. Valleys in SLP often indicate frontal passages, and will often coincide with pronounced changes in wind direction, temperatures, and humidity. In subtropical regions (the deserts of the Southwest, and much of the Sunbelt during summer) the SLP often oscillates daily, with a peak in the early morning and a trough during mid-afternoon.
"Stability Indices
The stability indices are measures of the potential for strong or severe weather. The indices shown here are the Lifted Index (LI) and the Convective Available Potential Energy (CAPE). The lifted index, indicated by the red line, is a measure of the thunderstorm potential which accounts for low-level moisture availability. LI values greater than 0 mean thunderstorms are unlikely. LI values between 0 and -2 mean thunderstorms are possible with good trigger. LI values between -3 and -5 mean thunderstorms are probable. LI values less than -5 mean a strong potential for severe thunderstorms.
"The purple bars indicate the CAPE value at the surface in units of J/kg. CAPE is a measure of the buoyancy of a layer. The larger the CAPE, the greater the potential for severe weather. Any value greater than 0 J/kg indicates instability and the possibility of thunderstorms. The base line for the bar graph of CAPE is 0.
"10-Meter Winds
""10-Meter Winds (about 33 feet above the ground) correspond to measured winds at weather stations. The orange line indcates the wind speed (in mph or m/s). The wind barbs are as in the time-height cross-section.
2-meter Temperatures
Air temperature and dew point temperature are given at the 2-meter level (6½ feet above ground). The dew point temperature is the temperature that a sample of air would have if it was cooled (at constant pressure) until it reached saturation. The dew point temperature is an alternative way to describe the amount of moisture or humidity in the air. If the dew-point temperature is close to the air temperature, the relative humidity is high, and if the dew point is well below the air temperature, the relative humidity is low. One technique for forecasting overnight low temperature is to look at the daytime dew point: if no fronts are expected to come through, tonight's low temperature will not get much below today's dew point.
"Air temperature is indicated by the solid brown line (with color shading below the line to aid interpretation). The dew point temperature is indicated by the dashed brown line. The freezing level is drawn with a dot-dashed black line. The vertical bars indicate the range of temperatures over the previous 3, 6, or 12-hour interval.
"2-Meter Relative Humidity
The green line and graduated green shading indicates the relative humidity.
"Cloud Cover
This panel has a blue background to show the cloud-free areas. The panel is divided into three horizontal layers for the display of low, middle, and high cloud cover, which are drawn as white bars. If the white bar covers the full height of its layer, that is 100% cloudiness. The white bars have no gap between them to better simulate the appearance of cloudiness in the panel.
"Precipitation
The bar graph at the bottom of the figure indicates predicted precipitation types and amounts. The color of the bar indicates the type of precipitation: rain, sleet, snow, or ice pellets. Narrow red bars within the wide bars indicates the portion of precipitation likely to come from convection (showers and thunderstorms)
"The precipitation amounts are in inches or millimeters. Values are accumulated precipitation over the previous forecast period, so no precip values are given at hour 00. The amounts are liquid water equivalents. For example, 1" of snow means one inch of water in the melted snow. It could mean anywhere from 3-12" of actual snow, depending on how "wet" the snowfall is. Depths of sleet and ice will more closely match their liquid water equivalents."
Courtesy of Dr. Michael Kaplan (Embry-Riddle Univ. Prescott, AZ) please consider now the 18 individual slide Snippets of the Yarnell Hill Fire -259m Simulation Powerpoint Presentation from the North Carolina Agricultural and Technical Univ. Students and Advisors Contributor: Shak Md Shajedul Karim & Jackson Wiles. Advisor: Drs. Michael L. Kaplan & Yuh-Lang Lin. Date: 06/09/2022


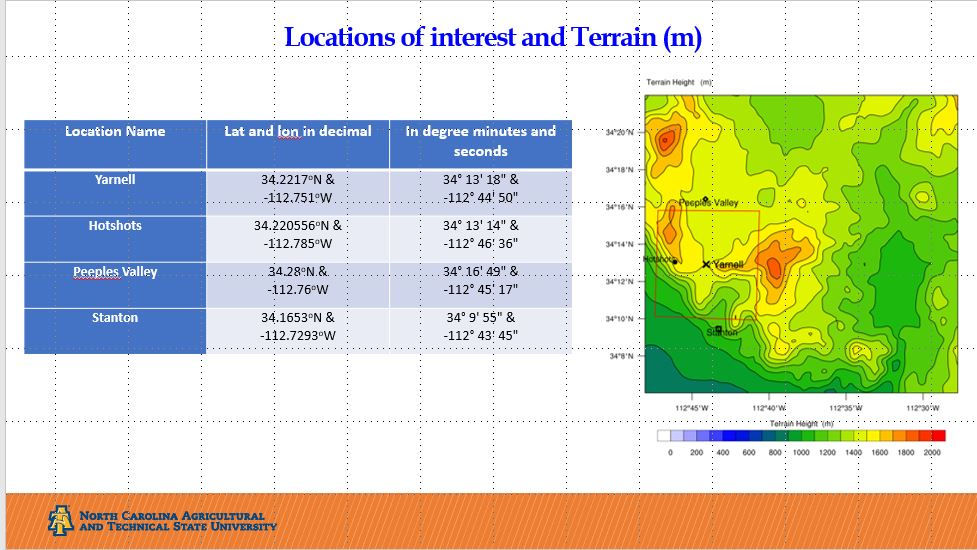


Figures 12. to 31. Snippets of Karim and Wiles (2022) Yarnell Hill Fire - 259m Simulation PowerPoint presentation indicating YH Fire, GMHS, Peeples Valley, Stanton; winds, reflectivity, surface temperatures. Model: ARW-WRF Version 3.6.1; Initialize by ERA5 0.25o × 0.25o Reanalysis data from 06/30/00Z – 07/01/00Z for d01, 06/30/12Z – 07/01/00Z for d02, 06/30/15Z – 07/01/00Z for d03, and 06/30/22Z – 07/01/00Z for d02. Source: NC Agri. and Tech.Univ.

Figure 31a. POSTER - Complex interactions among density currents, terrain heating, channeling, and blocking leading to erratic wildfire motions during the Yarnell Hill Fire. Atmospheric Scientists Kaplan et al (2022) Mountain Meteorology Conf. Source: ERAU, Univ. NC
Consider now Figure 32. and Figure 32a. below for the Snippets of the archived June 30, 2013, 0315 AM and 1159 AM respectively NOAA (Norman, OK) Storm Prediction Center (SPC) Fire Weather Outlooks indicating dry thunderstorm potential for Eastern AZ

 DAY 1 FIRE WEATHER OUTLOOK
   NWS STORM PREDICTION CENTER NORMAN OK
   1159 AM CDT SUN JUN 30 2013

   VALID 301700Z - 011200Z

   ...CRITICAL FIRE WEATHER AREA FOR PARTS OF CNTRL/ERN UT...NERN
   AZ...NWRN NM...FAR SWRN CO...
   ...CRITICAL FIRE WEATHER AREA FOR NERN NV...

   ...PARTS OF CNTRL/ERN UT...NERN AZ...NWRN NM...FAR SWRN CO...
   DRY TSTM AREA HAS BEEN EXPANDED TO THE NW ACROSS THE FOUR CORNERS
   REGION INTO ERN UT...WHILE IT HAS BEEN TRIMMED ON THE SRN/ERN EDGE
   ACROSS ERN AZ/WRN NM. STRONG HEATING ACROSS THE HIGH TERRAIN AND A
   SERIES OF LOW-AMPLITUDE WAVES MOVING AROUND THE UPPER RIDGE WILL
   SUPPORT SCATTERED TSTM COVERAGE THIS AFTERNOON AND EARLY EVENING.
   MODE MAY BE BORDERLINE DRY/WET ACROSS MUCH OF THE AREA...BUT WITH
   GPS PW VALUES RUNNING BETWEEN 0.5-0.75 INCHES AND DRY FUELS
   PRESENT...A LOW-END CRITICAL DRY-TSTM AREA APPEARS JUSTIFIED.

   THE SRN EDGE OF THE PREVIOUS CRITICAL AREA WAS TRIMMED ACROSS
   E-CNTRL AZ/W-CNTRL NM...WHERE IS APPEARS THAT MOISTURE VALUES WILL
   BE SUFFICIENT FOR SOMEWHAT GREATER RAINFALL AMOUNTS.
Figure 32. June 30, 2013, 1159 AM Critical Fire Weather areas Source: NOAA Storm Prediction Center

ZCZC SPCFWDDY1 ALL
   FNUS21 KWNS 300815

   DAY 1 FIRE WEATHER OUTLOOK
   NWS STORM PREDICTION CENTER NORMAN OK
   0315 AM CDT SUN JUN 30 2013

   VALID 301200Z - 011200Z

   ...CRITICAL FIRE WEATHER AREA FOR WRN NM...FAR E-CNTRL AZ...

   ...SYNOPSIS...
   AMPLIFIED WRN RIDGE/ERN TROUGH PATTERN WILL PREVAIL ACROSS THE CONUS
   TODAY WITH LITTLE SIGNIFICANT CHANGE FROM YESTERDAY. UPPER RIDGE
   WILL SHIFT SLIGHTLY WWD AS A SHORTWAVE TROUGH MOVES THROUGH THE
   UPPER TROUGH...WITH RESULTANT AMPLIFICATION...AND A DEEP LOW OVER
   THE NERN PACIFIC OCEAN AMPLIFIES. AT THE SURFACE...FRONTAL BOUNDARY
   WILL EXTEND FROM THE TX COASTAL BEND EWD TOWARDS THE MOUTH OF THE MS
   RIVER THEN NEWD...REMAINING ROUGHLY PARALLEL TO THE
   APPALACHIANS...INTO NY. SEASONABLY STRONG SURFACE HIGH WILL CONTINUE
   BUILDING ACROSS THE PLAINS. POTENTIALLY RECORD-BREAKING
   TEMPERATURES WILL CONTINUE ACROSS THE WRN GREAT BASIN...AZ...AND
   CNTRL/SRN CA WHILE BELOW AVERAGE TEMPERATURES ARE EXPECTED ACROSS
   THE CNTRL AND SRN PLAINS.

   ...WRN NM...FAR E-CNTRL AZ...
   THE SLIGHT WWD RETROGRESSION OF THE UPPER RIDGE SHOULD ALLOW
   STRONGER LOW-LEVEL MOISTURE ADVECTION INTO CNTRL/SRN HIGH PLAINS
   WITH A RESULTANT MOISTURE GRADIENT FROM THE FOUR CORNERS TO THE
   CNTRL/SRN HIGH PLAINS. EARLY MORNING SATELLITE IMAGERY SHOWS A
   CONVECTIVELY-INDUCED VORTICITY MAXIMA MOVING ACROSS ERN NM WITH A
   CORRESPONDING INCREASE IN MID-LEVEL MOISTURE. SATELLITE-DERIVED PW
   VALUES REVEAL THIS WELL WITH VALUES ACROSS CNTRL NM INCREASING FROM
   0.6-0.75 INCH AT 00Z TO 0.9-1.0 INCH AT 06Z. MODEL SOUNDINGS SHOW A
   SIMILAR TREND...ALBEIT SLIGHTLY SLOWER THAN OBSERVED. SATELLITE
   IMAGERY ALSO SHOWS ANOTHER VORTICITY MAXIMA BENEATH THE RIDGE OVER
   SW WY. THIS FEATURE...AT LEAST MODEST MOISTURE...AND STRONG DAYTIME
   HEATING/BOUNDARY LAYER MIXING WILL RESULT IN SCATTERED TO NUMEROUS
  3 WET TSTMS THROUGHOUT THE CNTRL/SRN ROCKIES. FARTHER W...MORE MEAGER
   MOISTURE WILL LIKELY FAVOR A MORE DRY TSTM MODE. GIVEN THE MOISTURE
   INCREASE NOTED ABOVE...THERE IS SOME POTENTIAL STORMS TRANSITION TO
   A MORE WET MODE. HOWEVER...GIVEN THE VERY DRY SUB-CLOUD
   LAYER...WHETHER STORMS BECOME PRIMARILY WET IS UNCERTAIN. SINCE
   CERTAINTY IN SCATTERED STORM COVERAGE IS HIGH...IT SEEMS PRUDENT TO
   LEAVE THE ONGOING CRITICAL RISK IN PLACE.  ZCZC SPCFWDDY1 ALL
   FNUS21 KWNS 301659
Figure 32a. June 30, 2013, 0315 AM Critical Fire Weather areas Source: NOAA Storm Prediction Center
Consider now three separate June 30, 2013, 1800 UTC, 2100 UTC, and July 1, 2013, 000 UTC respectively, GOES-15 NOAA GIBBS [Global ISCCP B1 Browse System] archive satellite Water Vapor Imagery (WVI). These images reveal the approximate location of the YH Fire and both dry intrusions, dry slots, and dry air aloft (subsidence), as well as moisture indicating incoming and intensifying thunderstorm activity, referred to in the text above. NOAA GIBBS GOES-15 archive Satellite WVI

Figure 33. Snippet of the June 30, 2013,1800 UTC (11:00 AM) GOES-15 Satellite WVI of the Southwest and approx. YH Fire location while revealing dry intrusions and dry slots (subsidence) denoted by the warm yellow and gold colors; blue (colder) colors indicate moisture and incoming thunderstorms in the Southwest Source: NOAA GIBBS

Figure 33a. Snippet of the June 30, 2013, 2100 UTC ( 2:00 PM) GOES-15 Satellite WVI of the Southwest and approx. YH Fire location revealing dry intrusions and dry slots (subsidence) denoted by the warm yellow and gold colors; blue (colder) colors indicate moisture and incoming thunderstorms in the Southwest Source: NOAA GIBBS

Figure 33b. Snippet of July 1, 2013, 0000 UTC (5:00 PM ) GOES-15 Satellite WVI of the Southwest and approx. YH Fire location revealing dry intrusions and dry slots (subsidence) denoted by the warm yellow and gold colors; blue (colder) colors indicate moisture and incoming and clearly intensifying thunderstorms in the Southwest Source: NOAA GIBBS
Consider now several WFSTAR NWCG Wildland Fire Weather-related videos. The Critical Fire Weather Patterns one is particularly engaging and informative.
Figure 34. How to Spin Weather Source: WFSTAR, NWCG, YouTube
Figure 34a. Red Flag Warning Source: NW Fire Science
Figure 34b. Fire Weather Forecast Source: WFSTAR, NWCG, YouTube
Figure 34c. Critical Fire Weather Patterns - Western United States Source: WLF LLC, YouTube
Figure 34d. Understanding the Fire Weather Environment Source: Periklis Athanasopoulos, YouTube
Figure 34e. Forecasting Fire Weather in the United States Source: NOAA Weather-Partners, YouTube
And now to address and answer the post title question: What Are The Known Yarnell Hill Fire Weather Factors Explaining What Led Up To The June 30, 2013, GMHS Fatalities?

Figure 35. Weather map simulation showing very high pressures at high altitudes over the Southwest which led to the record hot conditions (WeatherBell.com)Jason Samenow July 1, 2013, at 12:10 p.m. EDT article titled Behind the weather that led to the deadly Yarnell Hill Fire Source: Washington Post
The known Yarnell Hill Fire weather factors explaining what led up to the June 30, 2013, GMHS fatalities were within days and weeks made quite clear what occurred and why with the fire weather, by very credible, experienced, knowledgeable, and respected meteorologists, Wildland Fire Weather Nerds, WFs, FFs, and others - like yourselves! And these factors are even more clearly examined and discussed in detail by meteorologists in two respective YH Fire weather research papers in 2021 and 2022 that pegged the wildland fire weather to a tee; and from a hometown Prescott, AZ Embry-Riddle Aeronautical University (ERAU) Atmospheric Scientist Michael L. Kaplan no less. And, of course, they honed in on how very predictable it all was.
Additionally, the GMHS failed to heed the first of the Ten Standard Fire Orders dealing with keeping informed on fire weather conditions and forecasts and certainly failed to recognize and heed and mitigate the several fire weather Watch Out Situations that were progressively and clearly apparent throughout the day as well.
The comments of many on the weather blogs were quite revealing as well asking good questions and making valid points, for the most part, several with experience too.
Hindsight Bias as some naysayers will allege? Hardly. More like"What's predictable is preventable." So saith Risk Management Consultant Gordon Graham in this short video clip geared more toward police officers, however, the principle lesson remains the same for all work groups, especially wildland fire.
Now go forth and perform your inherently dangerous jobs exceptionally well after your newfound YH Fire weather knowledge!
Figure 36. Risk Management Consultant Gordon Graham - What's Predictable is Preventable video clip. Source: Lexipol. YouTube

Figure 37. photo of the world-renowned Payson Hot Shot Crew wearing full PPE as well as carrying their handtools properly compared to most aerial-delievered WFs Source: flickr.com
Proceed to the YHFR What Are The Known Fatal Yarnell Hill Fire Weather Factors Explaining What Led Up To The June 30, 2013, GMHS Fatalities? Part 2
UPDATES: Minor spelling, punctuation, and grammar edits; added quotation marks to all authored texts; emphasized and commented on several of the Commenter’s posts; and clarified that research paper Figures were stand-alone. June 17, 2022, at 1030 AM
Caption for Figures 12 to 31 abbreviated; ADDED Figure 31a. POSTER - Complex interactions among density currents, terrain heating, channeling, and blocking leading to erratic wildfire motions during the Yarnell Hill Fire. Atmospheric Scientists Kaplan et. (2022) Mountain Meteorology Conf. Source: ERAU, Univ. NC July 12, 2022, at 6:58 PM

Comments